


please send a mail
-->here<--
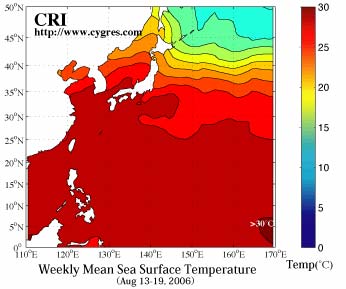
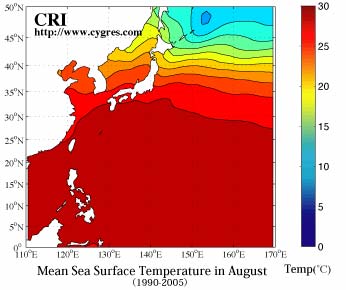
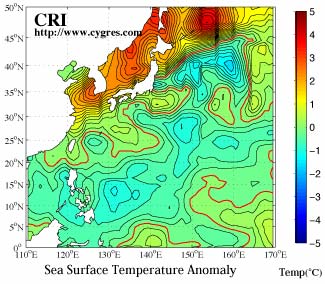
The left figure above shows weekly (August 13 through August 19, 2006) mean sea surface temperature (SST) near Japan. The data are Optimum Interpolation Sea Surface Temperature V2 obtained from NOAA-CIRES Climate Diagnostics Center, Boulder, Colorado, USA. The right figure above shows mean sea surface temperature in August averaged over 1990 through 2005. The SST at the right bottom corner in this figure exceeds 30C. We produced another figure below which shows the differences between right and left figures above. The red solid line in the figure below indicates zero difference.
We reserve the copyrights of all the figures shown in our web site. If you want to pass(send a copy) our figures to the third-party, we ask you to do so without getting any thing, either money, goods, preferences and/or anything, in return. Also, we ask you to notify the status of the copyrights of our figures to that third-party. If you want to use entire or parts of our figures, we ask you to show the origin and the status of the copyright explicitly in your documents where our figures are going to be used. We appreciate very much if you let us know your usage of our figures in that case.
Thank you.
CRInternational