


please send a mail
-->here<--
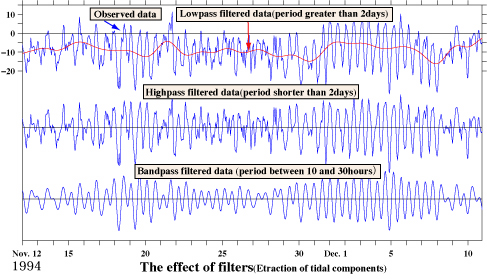
The figure above shows the effects of filters. The data were the same ADCP data shown in another figure and we picked up those at 85m. The top blue solid line indicates original data. The sampling interval of these data is one hour and no filter was applied. The red solid line indicates low pass filtered data. The cutoff period of this low pass filter is 2 days. The blue line in the middle indicates high pass filtered data, the cutoff period of which was 2 days. The spring-neap tidal cycle became fairly clear in this figure but not quite good enough yet. Then, we applied a band pass filter, which passes variations of 10 to 30 hours periods, to these data. The result is shown as the bottom blue line. Now, spring-neap cycle of tidal variations becomes very clear. I would like to make a note that, we usually do not use a band-pass filter to estimate the amplitudes and phases of tidal components. Instead, we use a method called harmonic analysis. However it is often useful to apply a high-pass filter to data in order to remove low frequency non-tidal variations before applying a harmonic analysis.
We reserve the copyrights of all the figures shown in our web site. If you want to pass(send a copy) our figures to the third-party, we ask you to do so without getting any thing, either money, goods, preferences and/or anything, in return. Also, we ask you to notify the status of the copyrights of our figures to that third-party. If you want to use entire or parts of our figures, we ask you to show the origin and the status of the copyright explicitly in your documents where our figures are going to be used. We appreciate very much if you let us know your usage of our figures in that case.
Thank you.
CRInternational